


GM Fort Wayne Explained: How 5,600 Vehicles Became Nine, and What Suppliers Can Do at the Cell Level
GM Fort Wayne Explained: How Plant Data Narrowed 5,600 Potentially Affected Vehicles to Nine—and What Suppliers Can Learn
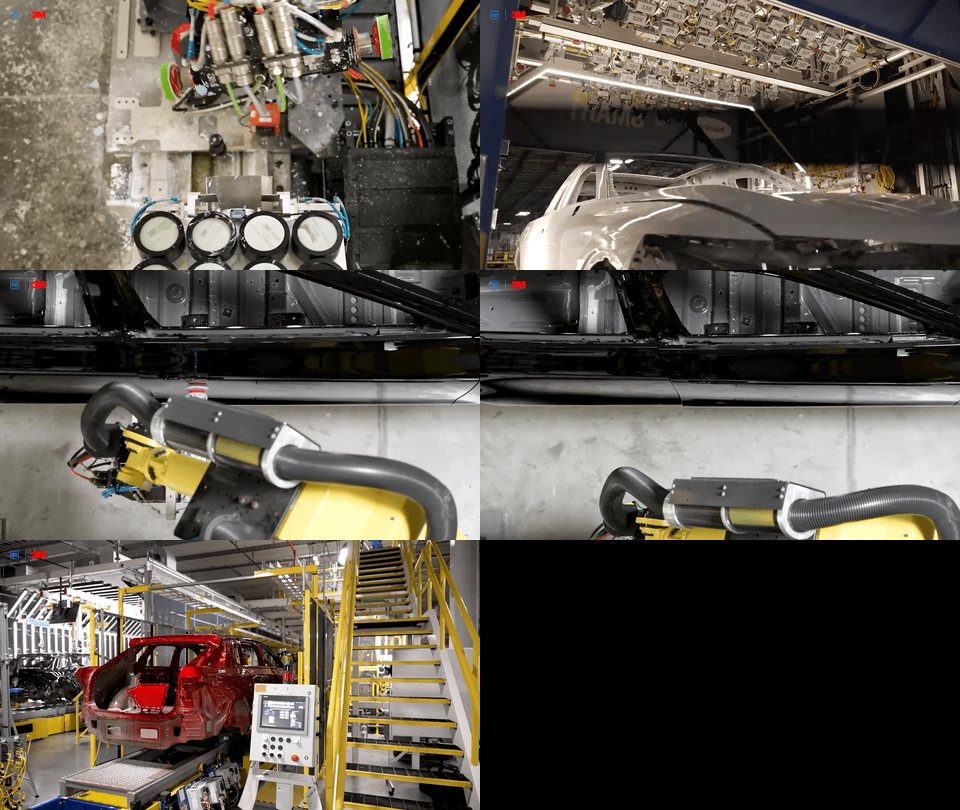
A missed weld prompted GM to investigate a group of 5,600 vehicles. Plant data narrowed the affected group to nine. Although GM’s tools rely on its own infrastructure, the underlying principle – identifying problems close to their source – can also guide improvements at a single production cell. In Bigwave’s view, that is a practical starting point for many suppliers.
What’s inside:
The case: What happened at GM’s Fort Wayne plant.
The cost: Why unplanned downtime matters.
The tools: How GM monitors equipment, inspects vehicles and plans production.
The cell: How vision-guided inspection adapts to tray positioning.
The path: Four steps from a single inspection cell to connected process data.
What Happened at Fort Wayne
A routine quality check at GM’s Fort Wayne Assembly plant identified a missed weld. According to GM, the team would previously have inspected all 5,600 vehicles in the potentially affected group by hand.
This time, data captured through Device Level Analytics (DLA) helped identify where welds had been missed and which vehicles were affected. The team narrowed the investigation to nine vehicles within hours rather than days. All nine were identified before leaving the building.
DLA collects data from plant sensors, including vibration, electrical current and other signals that indicate equipment performance. GM says it has used this information to schedule preventive maintenance and plans to expand its use of machine learning and AI as the system develops. (GM News)
Why a Stopped Line Costs So Much
An assembly-line stoppage can cost between $10,000 and $50,000 per minute, Automotive Manufacturing Solutions (AMS) reported on October 28, excluding overtime needed to recover lost output.
Siemens’ The True Cost of Downtime 2024, based on a survey of large industrial organizations, estimates that an hour of unplanned downtime at a large automotive plant costs $2.3 million. The report says that figure rose 113% between 2019 and 2023.
Actual costs vary by facility. These estimates nevertheless illustrate why early detection matters: identifying a problem sooner can limit the disruption, inspection and rework that follow.
How GM Monitors Equipment, Inspects Vehicles and Plans Production
According to AMS, GM describes its digital manufacturing technology as primarily developed internally, supported by cloud platforms and its own data infrastructure. Partner technologies support monitoring, quality inspection and planning, including NVIDIA tools for training AI models used in factory planning and robotics.
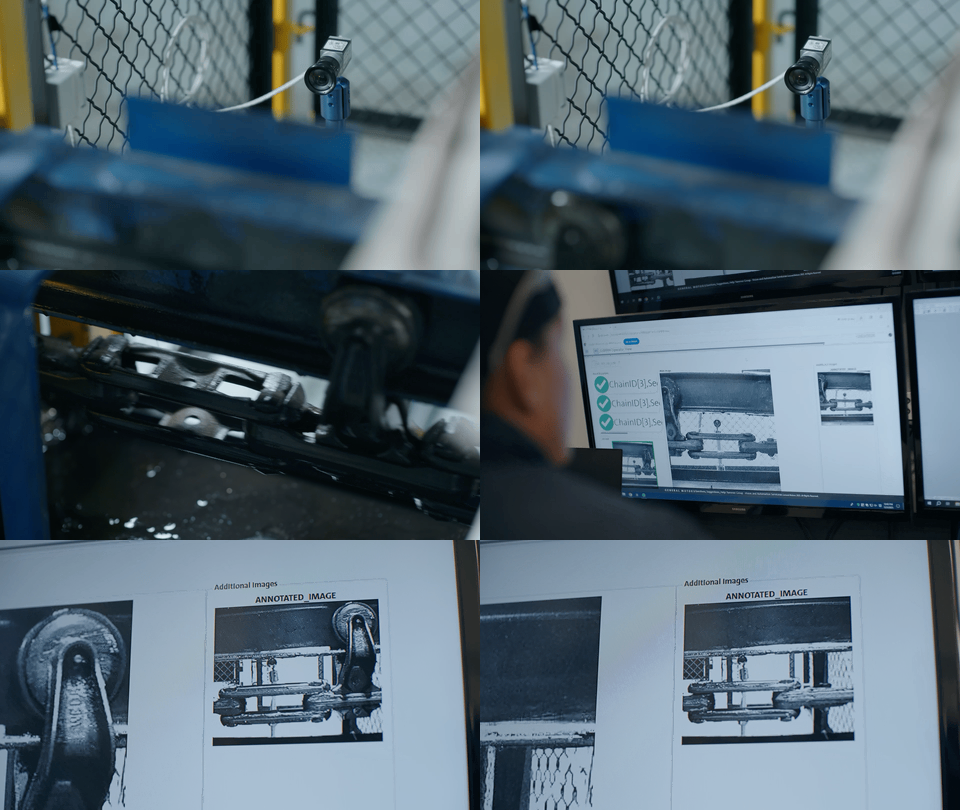
Monitoring equipment. DLA monitors hundreds of thousands of devices, according to GM. AMS reports that the company uses vibration sensors and machine-learning models to monitor conveyors, with performance data sent to a centralized cloud platform.
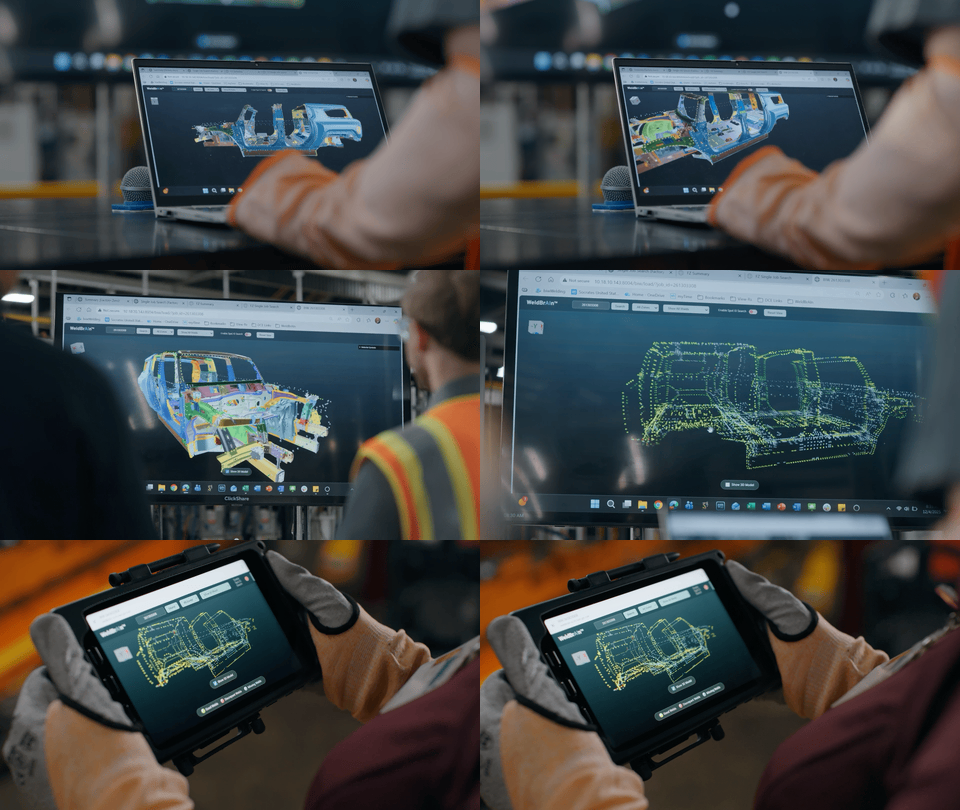
Inspecting vehicles. WeldBrAIn, an AI weld-inspection system being piloted at Factory ZERO, expanded inspection from manual checks of four parts per shift to real-time checks of every weld on every body, according to GM. At Spring Hill and Flint, Finesse Paint Repair cameras detect small paint imperfections as vehicles move down the line. Defect data is then shared with paint process engineers to inform adjustments.
Planning production and product development. GM uses digital twins—virtual models of its facilities—to evaluate production lines before building them. AMS also reports that, at its GM Forward event this month, the company announced a goal of halving vehicle development times and said it had evaluated more than 300,000 battery designs virtually before building a physical prototype.
These applications serve different purposes. Equipment monitoring helps identify maintenance needs; inspection evaluates product quality; and virtual modeling supports planning and development. For a supplier starting with one process, automated inspection may offer the most directly applicable example.
What Suppliers Can Apply on Their Own Floors
Suppliers do not need to replicate GM’s infrastructure to apply some of the same principles. The Fort Wayne case illustrates the value of capturing data close to the process and using it to identify affected products quickly. WeldBrAIn demonstrates a related approach: expanding inspection beyond a limited sample.
In Bigwave’s view, a defined inspection cell is one practical place to begin. A camera, a robot and a specified set of checks can support consistent inspection while generating records for quality analysis. The scope and reliability of those checks must be validated for the application.
The Cell: Vision-Guided Inspection That Adapts to Tray Position
Inspection systems often depend on parts arriving in predictable positions. On mixed-product lines, tray alignment and product presentation can vary. One Bigwave client reported difficulty maintaining inspection accuracy under these conditions.
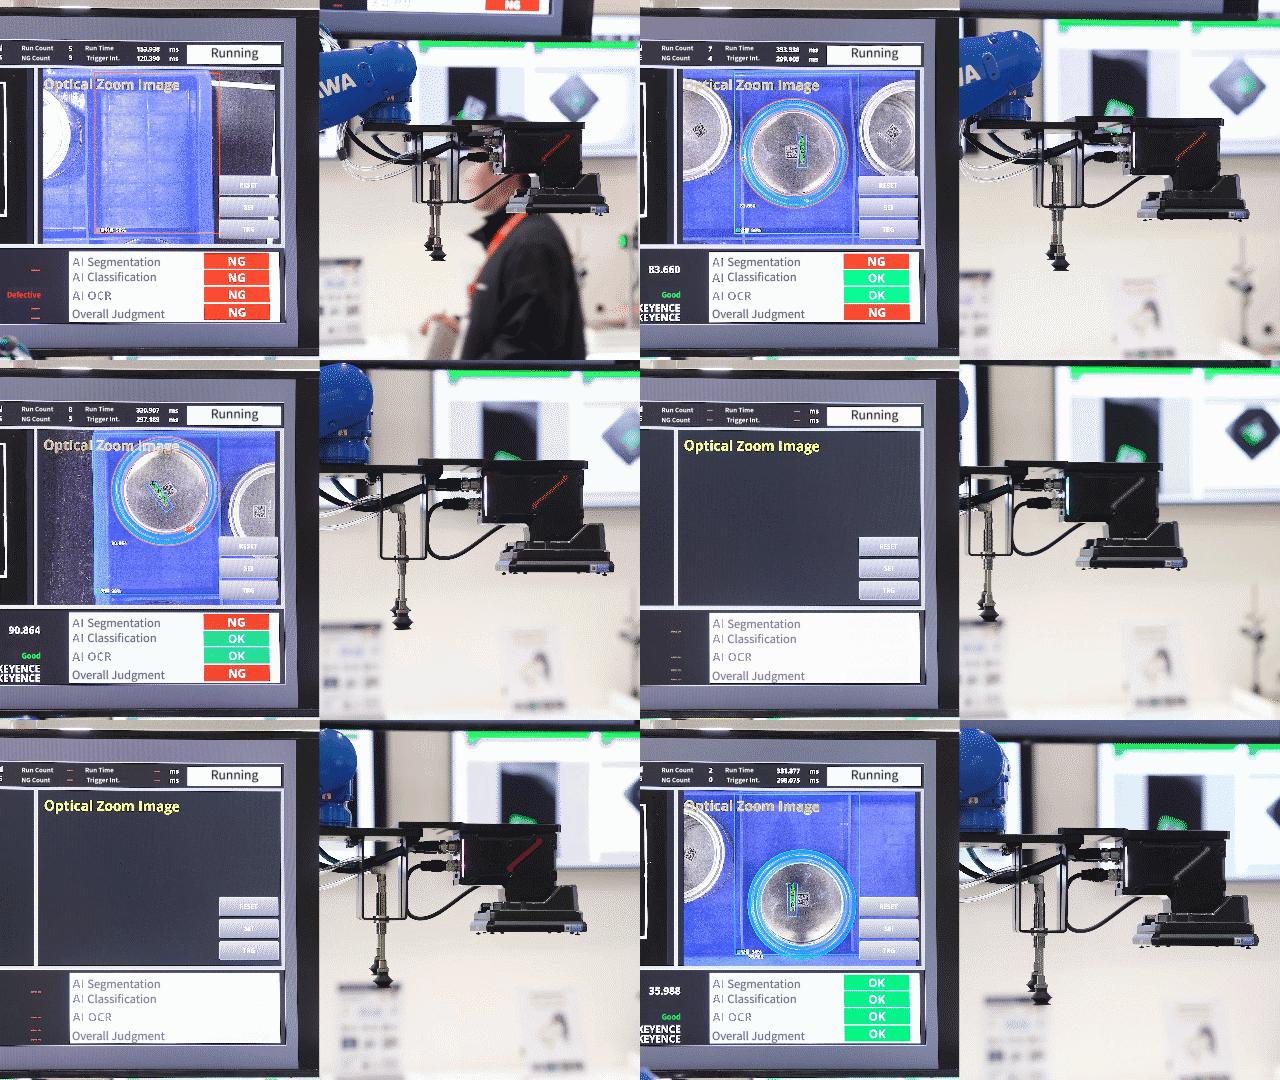
Bigwave Robotics built an inspection cell around Keyence’s VS Series AI vision system, which combines a camera, controller and lens in one unit. Bigwave demonstrated the workflow at the AW 2026 exhibition.
The process follows six steps:
Locate the products. A tray enters the inspection zone, and the camera captures the field of view.
Analyze the arrangement. The system identifies the positions and arrangement of the tray and its contents.
Correct the robot’s coordinates. Vision data guides adjustments to the robot’s handling position based on the tray’s actual location and orientation.
Run the inspection. Using the corrected coordinates, the cell checks position, appearance, presence, quantity and dimensions. It also performs optical character recognition (OCR) and barcode reading (BCR).
Evaluate more complex features. AI tools support irregular-text recognition, mixed-product sorting and pixel-level identification of fine or irregular defects.
Record the results. Inspection results are stored as process data for quality control and productivity analysis.
Client feedback. According to the client, combining position recognition, visual inspection and OCR with robot adjustments for tray orientation has “significantly increased both inspection reliability and operational stability.” Bigwave has not published quantified performance results for this cell.
What the example demonstrates. This application connects inspection directly to robot control at a specific station. It addresses variation in how trays arrive and generates data for subsequent analysis. Its scope differs from GM’s plant-wide equipment monitoring and does not establish equivalent performance or traceability.
Four Steps From One Cell to Connected Process Data
The following is Bigwave’s recommended approach, rather than a GM process:
Identify a source of variation. Start where tray alignment, fixture positioning or product mix makes handling and inspection inconsistent.
Integrate vision-guided inspection. Add checks within the existing process and use position data to guide robot adjustments.
Capture useful records. Store pass/fail results, measurements and images. Where traceability is required, associate those records with the relevant part or batch.
Review before expanding. Assess inspection performance and operational results, then determine whether the approach is suitable for another cell.
The first cell provides a defined scope for evaluating performance and establishing consistent data collection. Expansion should follow evidence from that initial application.
Start With One Cell With Bigwave Robotics
Bigwave Robotics engineered the inspection cell described above. As a brand-agnostic integrator, the company combines robots and vision systems from different suppliers with its SOLlink software to support projects ranging from individual cells to broader automation deployments.
Manufacturers exploring inspection improvements can share tray layouts, product variations and defect records with Bigwave’s engineering team to identify a suitable starting point.
Stay Updated on Industry Trends
[Join our LinkedIn Newsletter]
Sources
How smarter AI tools help build better vehicles — GM News, May 5, 2026
GM’s predictive future for manufacturing — Automotive Manufacturing Solutions, October 28, 2026